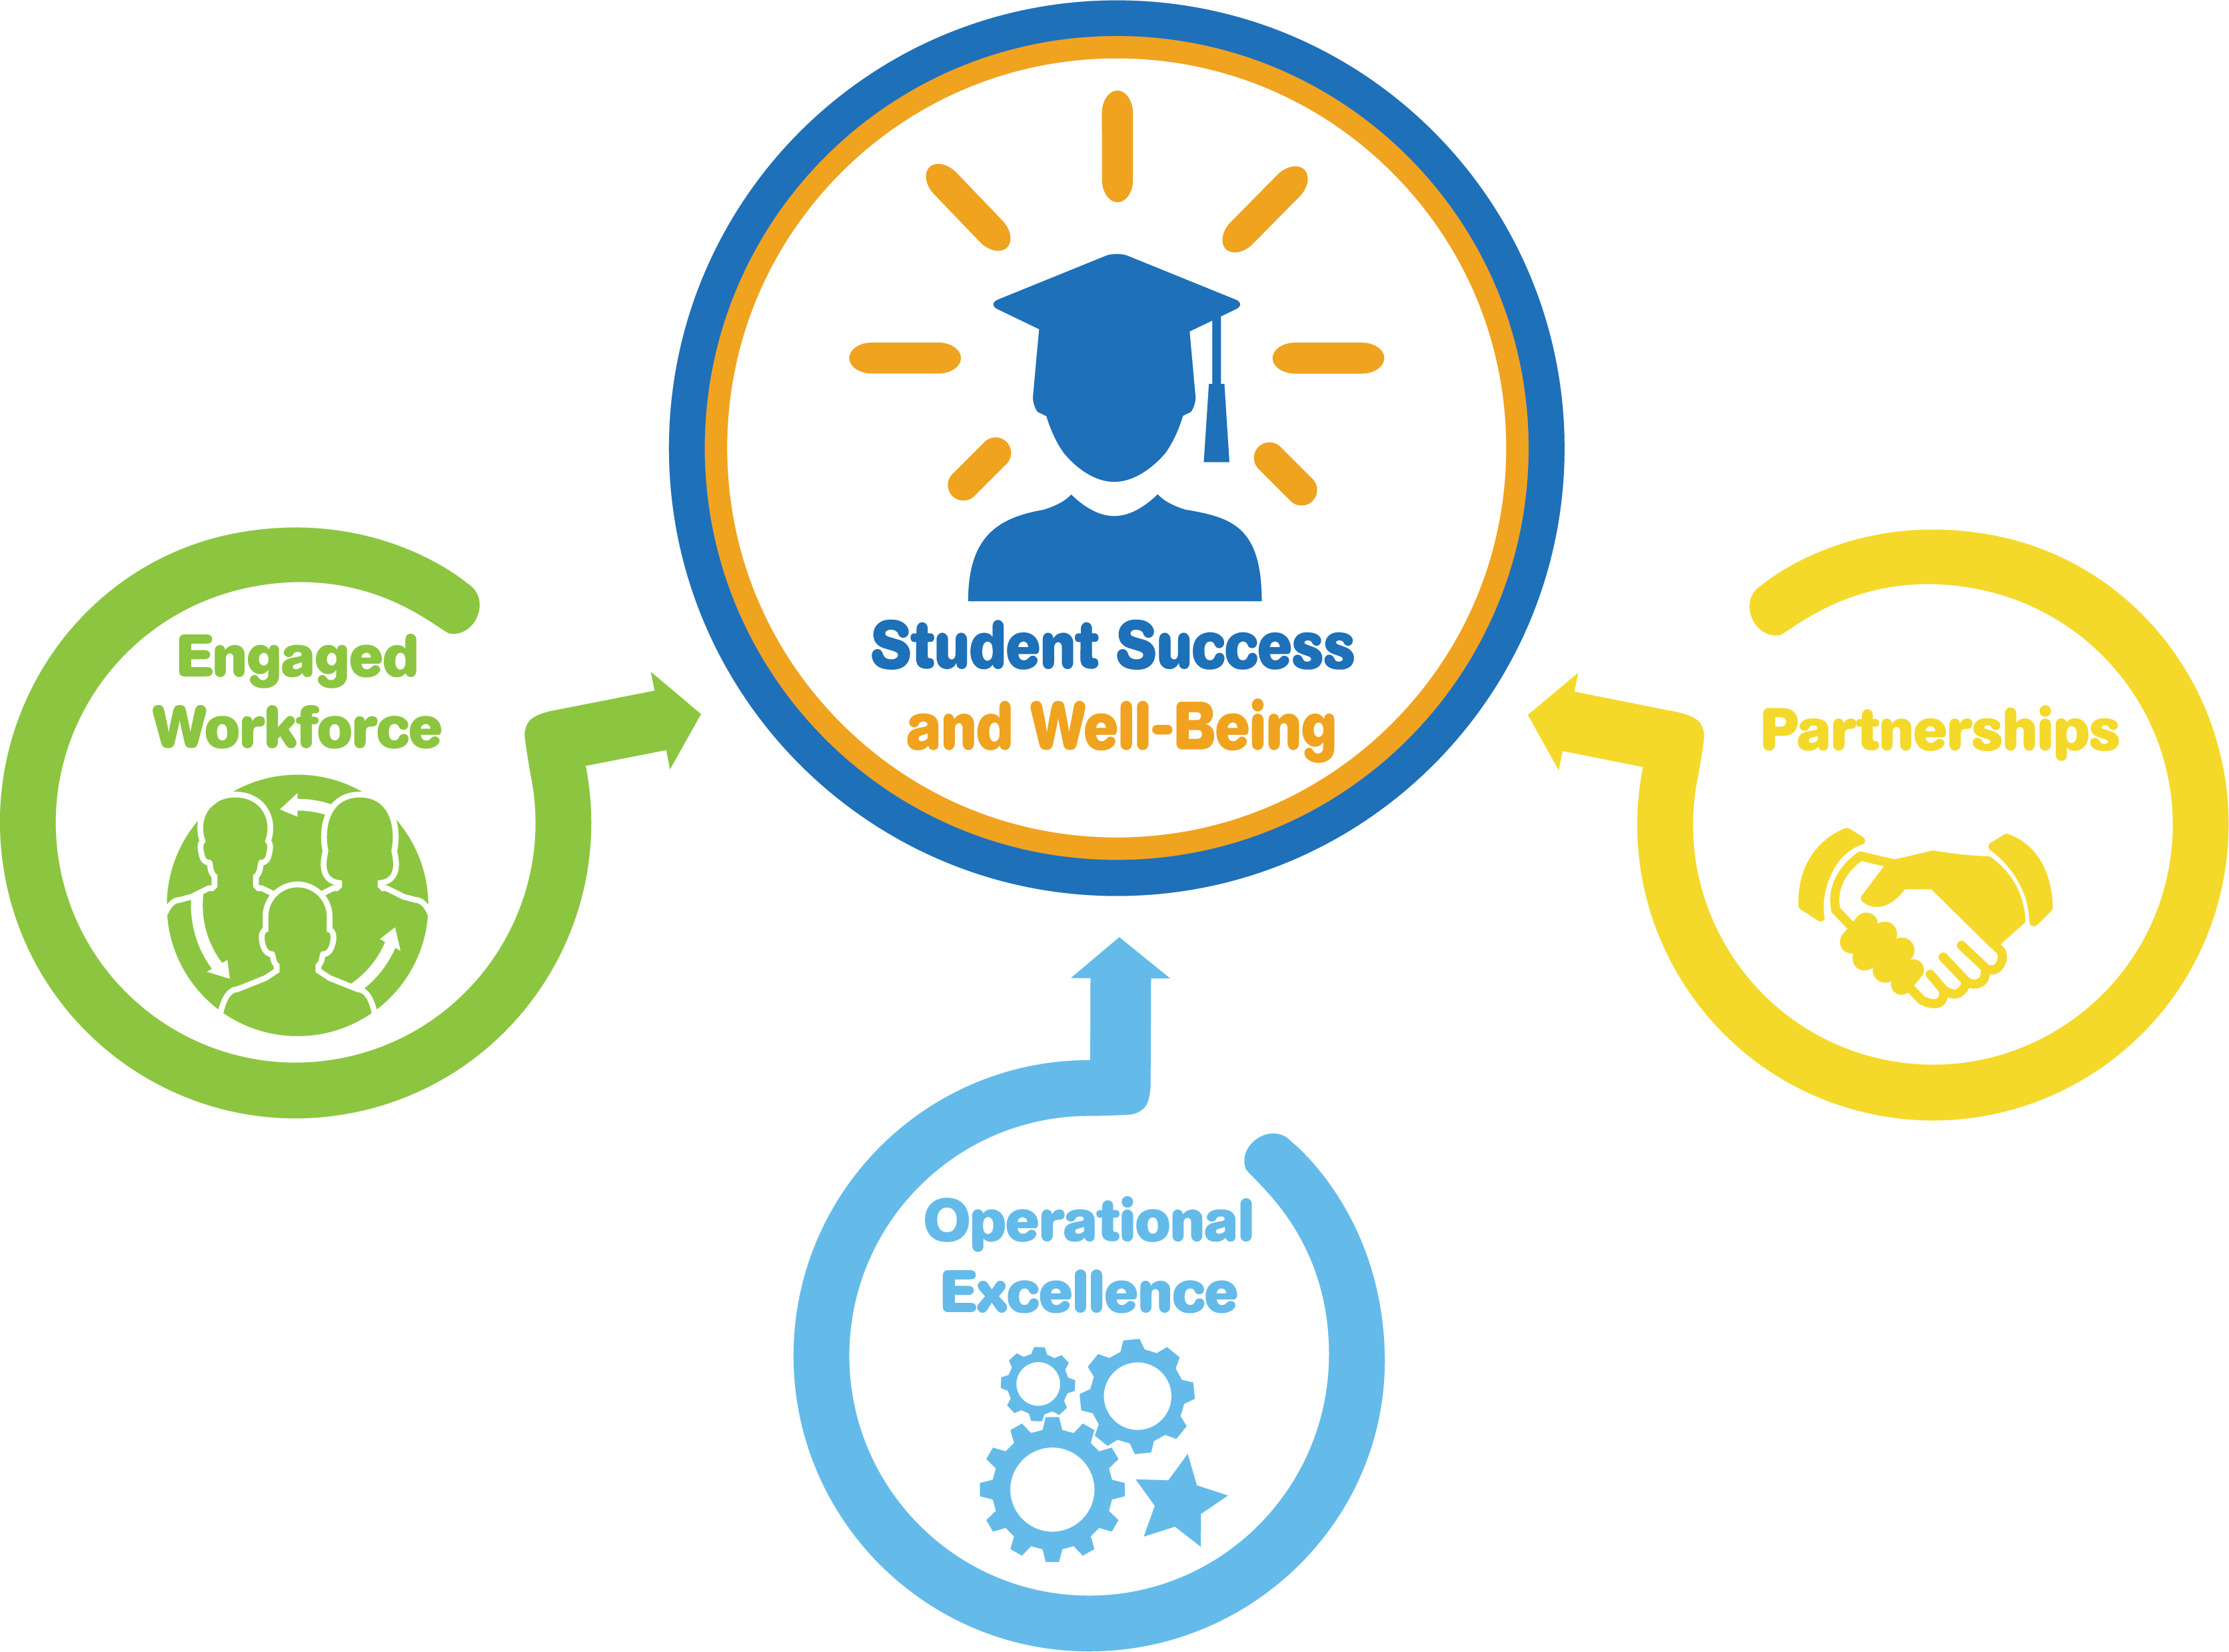
 The ten Strategic Plan Performance Objectives are the vital few measures of progress in our most critical areas of focus. Each Performance Objective provides a holistic measure over a specific topic. Details are provided through a rich set of linked additional data and deep dives. Since the Performance Objectives look at the division as a whole they are not organized by Goal.
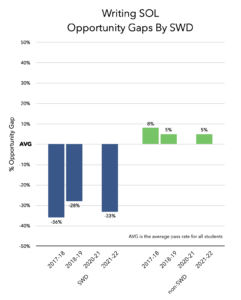
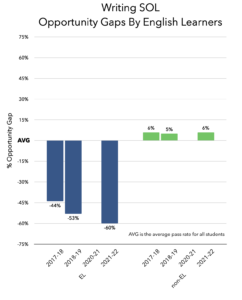
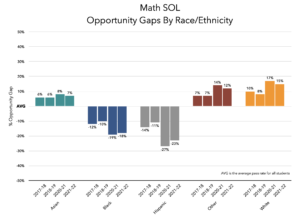
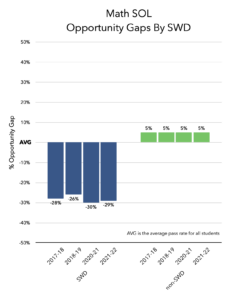
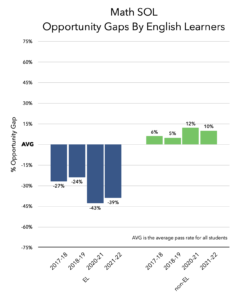
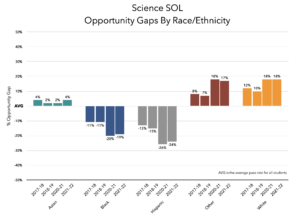
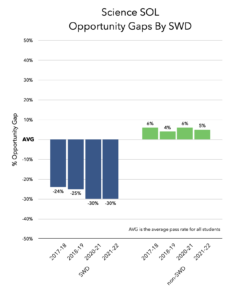
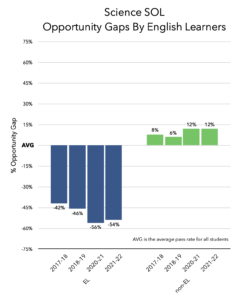
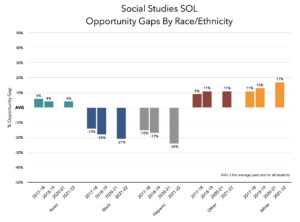
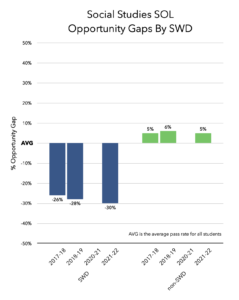
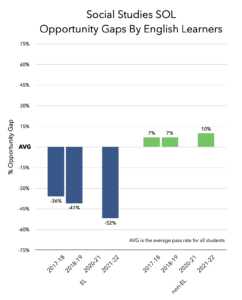
- By 2024, APS will reduce opportunity gaps for all reporting groups on state assessments. (PO-SS-1)
- By 2024, all elementary and middle school students will annually demonstrate growth by a minimum of one level using district assessments and students performing at the advanced level will continue to perform at the advanced level. (PO-SS-2)
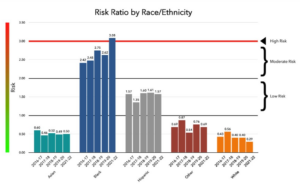
- Disproportionally in suspension rates by race/ethnicity, students identified with a disability, and English Learners will be annually reduced and overall suspensions will not increase. (PO-SWB-1)
- By 2024, at least 80% of students with disabilities will spend 80% or more of their school day in a general education setting. (PO-SWB-2)
- Key findings on the Your Voice Matters survey will show improvements in student social, emotional, and mental health. (PO-SWB-3)
- By 2024, at least 70% of APS staff will respond favorably that opportunities for professional learning meet their needs, as indicated on the Your Voice Matters survey. (PO-EW-1)
- By 2024, APS staff will respond at the 75th percentile or better on staff engagement and climate, as indicated by the Your Voice Matters survey. (PO-EW-2)
- By 2024, all staff participate in training that meets or exceeds industry standards for their position. (PO-EW-3)
- Organizational operations will continuously improve their effectiveness as measured by identified KPIs. (PO-OE-1)
- By 2024, at least 90% of APS families will respond favorably on student and family engagement on the Your Voice Matters survey results. (PO-P-1)
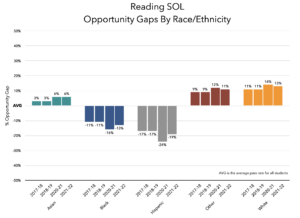
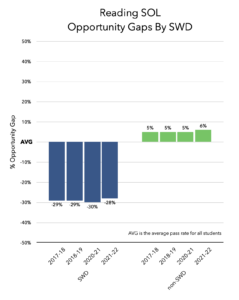
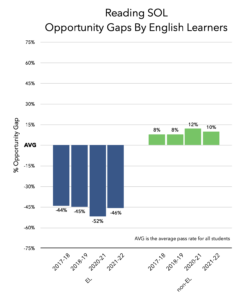
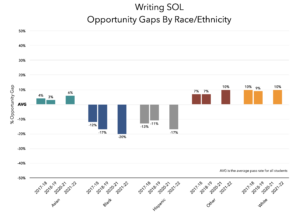
By 2024, APS will reduce opportunity gaps for all reporting groups on state assessments. (PO-SS-1)
APS’s mission is to ensure all students learn and thrive in safe, healthy, and supportive learning environments. The division’s role is to ensure every student graduates college and career ready. While opportunity gaps between groups have been reduced, they continue to persist. This performance objective is a key measure of APS’s success in reducing and eventually eliminating those gaps.
The graphs and data tables below show trend data on student group opportunity gaps compared to their peers on the Reading, Writing, Math, Social Studies and Science SOL’s. Due to COVID-19 Virginia did not administer SOL’s in the spring of 2020 and only some were administered in 2021.
Reading SOL
Writing SOL
Math SOL
Science SOL
Social Studies SOL
Deep dives and additional data on this performance objective
- Academic Progress Update – August 2018 | August 2019 | August 2020 | August 2021 | August 2022
- English Language Arts Update – May 2018 | May 2019 | May 2020 | January 2020 PPT– Appendix | May 2021 | May 2022 | April 2023
- English Learners Update – January 2018 | October 2019 – PPT – Report | March 2020 | March 2021 | March 2022 | November 2022 | March 2023
- Mathematics Update – February 2018 | February 2020 | September 2021 | October 2022
- Science Update – March 2018 | December 2018 | March 2020 |
- Social Studies Update – January 2018 | February 2019 | March 2020 | April 2021
- Special Education Update – June 2019 | December 2020 | April 2021 | March 2022 | April 2023
- Additional data
Strategic Plan | Performance Objectives | Strategies
By 2024, all elementary and middle school students will annually demonstrate growth by a minimum of one level using district assessments and students performing at the advanced level will continue to perform at the advanced level. (PO-SS-2)
This performance objective primarily measures if each student makes one level of academic progress each school year, which is essential if opportunity gaps are to be eliminated. It secondarily measures that high-performing students continue to perform at high levels. Growth measures complement the overall achievement measures in PO-SS-1 by helping to inform the cause of achievement gaps. This understanding helps APS to target its improvements at the root cause of the gaps.
The graphs and data tables below show the percentage of elementary and middle school students that demonstrated at least one level of growth from 2020-21 to 2021-22 on the Math Inventory (grades 2-8), Reading Inventory (grades 6-8), and DIBELS (grades K-5) – Dynamic Indicators of Basic Early Literacy Skills.
GRAPH – Will be available in Summer 2023
DATA TABLE – Will be available in Summer 2023
Deep dives and additional data on this performance objective
- Academic Progress Update – August 2018 | August 2019 | August 2020 | August 2021 | August 2022
- English Language Arts Update – May 2018 | May 2019 | May 2020 | January 2020 PPT– Appendix | May 2021 | May 2022 | April 2023
- English Learners Update – January 2018 | October 2019 – PPT – Report | March 2020 | March 2021 | March 2022 | November 2022 | March 2023
- Gifted – January 2023
- Mathematics Update – February 2018 | February 2020 | September 2021 | October 2022
- Science Update – March 2018 | December 2018 | March 2020 |
- Social Studies Update – January 2018 | February 2019 | March 2020 | April 2021
- Special Education Update – June 2019 | December 2020 | April 2021 | March 2022 | April 2023
- Additional data
Strategic Plan | Performance Objectives | Strategies
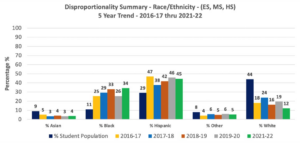
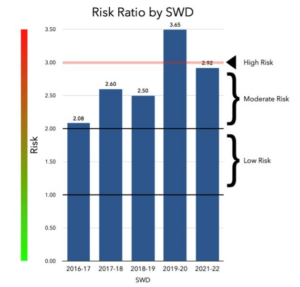
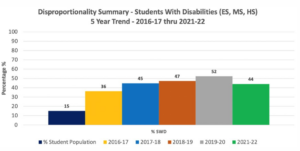
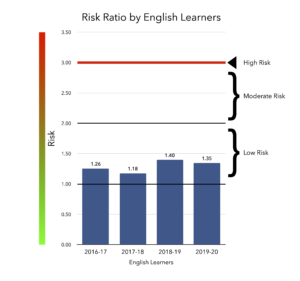
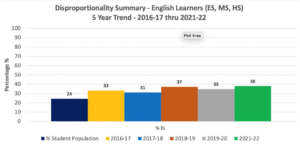
Disproportionality in suspension rates by race/ethnicity, students identified with a disability, and English Learners will be annually reduced and overall suspensions will not increase. (PO-SWB-1)
APS is committed to improving school and student climate, culture, and outcomes from behavior incidents. As a result, APS will establish systematic, proactive, and positive strategies, and interventions, that support student learning, behavior, and well-being in all areas involving student conduct. In that effort APS will adopt several frameworks to improve climate and culture. The frameworks include Restorative Justice practices, Trauma-Informed Practices, and Social-Emotional Learning, which are designed to support positive student behaviors and provide tools for staff to respond to student behaviors in a supportive way rather than punish adverse behaviors. This performance objective is the key measure of the success of the program.
The graphs and data tables below show trend data on disproportionality and the relative risk of student groups being suspended compared to their peers. The risk ratio is calculated using the formula provided by the Virginia Department of Education.
Risk Ratio & Levels of Disproportionality:
- Low: a relative risk greater than 1 and less than 2 (1.0 – 1.9)
- Moderate: a relative risk greater than or equal to 2 and less than 3 (2.0 – 2.9) – indicates that the group is 2 times as likely to be suspended as their peers
- High: a relative risk greater than 3 (3.0+) – indicates that the group is 3 times as likely to be suspended as their peers
Deep dives and additional data on this performance objective
- APS Responses to Student Behaviors Monitoring Report – October 2021
- School Climate & Culture Monitoring Report – October 2022
- Additional data
Strategic Plan | Performance Objectives | Strategies
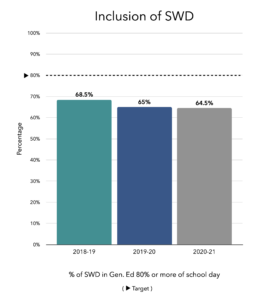
By 2024, at least 80% of students with disabilities will spend 80% or more of their school day in a general education setting. (PO-SWB-2)
Students with Disabilities (SWD) have historically spent much of their school day in separate instructional settings. Research indicates that all students who spend more time with their non-disabled peers, both for academics and non-academic activities, have positive outcomes. This performance objective is a key measure of APS’s success in achieving higher levels of inclusion, that is students with disabilities accessing instruction in the general education setting.
The graph and data table below shows trend data on APS’s progress toward this performance objective.
Deep dives and additional data on this performance objective
- Special Education Update – June 2019 | December 2020 | April 2021 | March 2022 | April 2023
- Additional data
Strategic Plan | Performance Objectives | Strategies
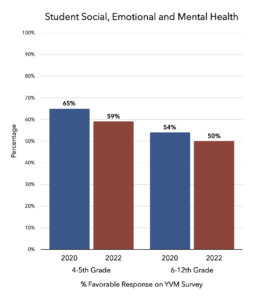
Key findings on the Your Voice Matters (YVM) survey will show improvements in student social, emotional, and mental health. (PO-SWB-3)
The COVID-19 pandemic has had a significant impact on student social, emotional and mental health. Students have experienced the social-emotional impact of the measures put in place to protect everyone’s physical well-being. This performance objective monitors the effectiveness of APS’s strategies designed to improve student’s well-being.
The graph and data tables below show the percentage of favorable responses by students on the 2020 and 2022 Your Voice Matters (YVM) survey on questions grouped under the topic of: Student Well-Being: Social, Emotional, Mental Health.
Deep dives and additional data on this performance objective
- Counseling Update – July 2022
- Student Services Update – March 2020 | March 2021 | May 2023
- Health, Physical, Driver Education Update – September 2018 | September 2019 | November 2020 |
- Your Voice Matters Survey (2022) – 4-5th Grade | 6-12th Grade includes the list questions students responded to and percentage of favorable response on each.
- Additional data
Strategic Plan | Performance Objectives | Strategies
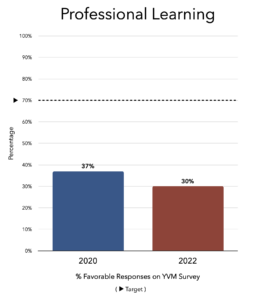
By 2024, at least 70% of APS staff will respond favorably that opportunities for professional learning meet their needs, as indicated on the Your Voice Matters survey. (PO-EW-1)
This performance objective measures staff perception of APS’s professional learning system. The staff’s perception about professional learning is a key measure of workforce engagement as professional learning shows that the organization is investing resources into growing and developing its workforce.
The graph and data tables below show the percentage of favorable responses by staff on the 2020 & 2022 Your Voice Matters (YVM) survey on questions grouped under the topic of: Engaged Workforce: Professional Learning.
Deep dives and additional data on this performance objective
- Professional Learning Update – May 2021 | July 2022 | May 2023
- Your Voice Matters webpage
- Additional data
Strategic Plan | Performance Objectives | Strategies
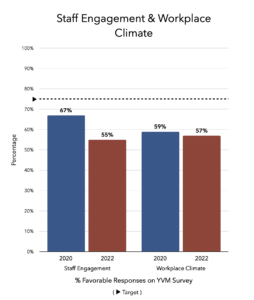
By 2024, APS staff will respond at the 75th percentile or better on staff engagement and climate, as indicated by the Your Voice Matters survey. (PO-EW-2)
This performance objectives measures the overall levels of workforce engagement and workplace climate. Several questions come from the Gallop Q12, a highly reliable measure of workforce engagement. The performance objectives also measures the workplace climate established by organizational leadership including topics such as respect, trust, support, and valuing diversity.
The graph and data tables below show the percentage of favorable responses by staff on the 2020 & 2022 Your Voice Matters (YVM) survey on questions grouped under the topics of: Engaged Workforce: Staff Engagement and Engaged Workforce: Workplace Climate.
Deep dives and additional data on this performance objective
- Human Resources Update – February 2018 | August 2019 | April 2021 | September 2022
- Your Voice Matters webpage
- Additional data
Strategic Plan | Performance Objectives | Strategies
By 2024, all staff participate in training that meets or exceeds industry standards for their position. (PO-EW-3)
APS’s staff provide a wide variety of services. Each service, from services to students such as academics and social/emotional support through operations services such as finance, technical, and maintenance, requires ongoing training to remain current on best practices. This performance objective monitors the division’s work of ensuring every staff member is receiving the training they need.
Data collection in progress
Deep dives and additional data on this performance objective
- Professional Learning Update – March 2019 | May 2020 | May 2021 | July 2022 | May 2023
- Your Voice Matters webpage
- Additional data
Strategic Plan | Performance Objectives | Strategies
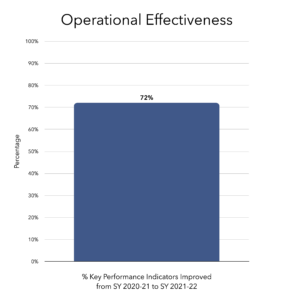
Organizational operations will continuously improve their effectiveness as measured by identified Key Performance Indicators (KPI’s). (PO-OE-1)
Operations provides a wide variety of services that support families and student learning. Each of APS’s sixteen support service areas has identified the most essential measure of the effectiveness of their service. This performance measure monitors the continuous improvement of these support service areas.
What are KPI’s?
Key Performance Indicators are indicators of progress toward an intended result. KPIs provides a focus for strategic and operational improvement. A few examples include: Aquatics Dept.- community satisfaction rates with swim school; Procurement Dept. – Number of business hours to approve a purchase order; Transportation – % requested services delivered on time.
The graph and data table below shows the percentage of Key Performance Indicators that were improved from 2020-21 to 2021-22.
Click below for additional context on the graph above (English)
Click below for additional context on the graph above (Spanish)
Deep dives and additional data on this performance objective
- Operations Update – | October 2021 | November 2022
- Human Resources Update – February 2018 | August 2019 | April 2021 | September 2022
- F&O Maintenance MC/MM Update – October 2019 | December 2020
- Transportation Update – March 2019 | March 2020
- Food Services Update – November 2018 | April 2021 |
- Finance: Final Fiscal Status Reports – January 2021 | January 2022 | January 2023
- Additional data
Strategic Plan | Performance Objectives | Strategies
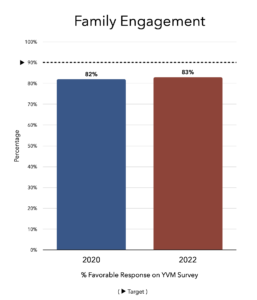
By 2024, at least 90% of APS families will respond favorably on student and family engagement on the Your Voice Matters (YVM) survey results. (PO-P-1)
Families are APS’s partners in ensuring every student learns and thrives in a safe, healthy, and supportive learning environment, graduating college and career ready. Family engagement is essential to supporting students. This performance objective measures the effectiveness of APS’s strategies to increase family engagement.
The graph and data tables below show the percentage of favorable responses by families on the 2020 & 2022 Your Voice Matters (YVM) survey on questions grouped under the topics of: Partnerships: Family Engagement. Results from the 2022 YVM survey will be added in August once available to show trend data on APS’s progress toward this performance objective.
Deep dives and additional data on this performance objective
- School & Community Relations Update – December 2019 | January 2021 | April 2022 | January 2023
- FACE Briefing Report – May 2020 | June 2021
- Your Voice Matters webpage
- Additional data
 Contact
  Calendars
 Careers
 Engage
  District
