State pass rates exceeded by 5% or more on 17 assessments
On August 15 the Virginia Department of Education (VDOE) released 2017 SOL results for all public school divisions and schools. Arlington Public Schools (APS) students continue to pass the Virginia Standards of Learning (SOL) tests at higher rates than their peers across Virginia.
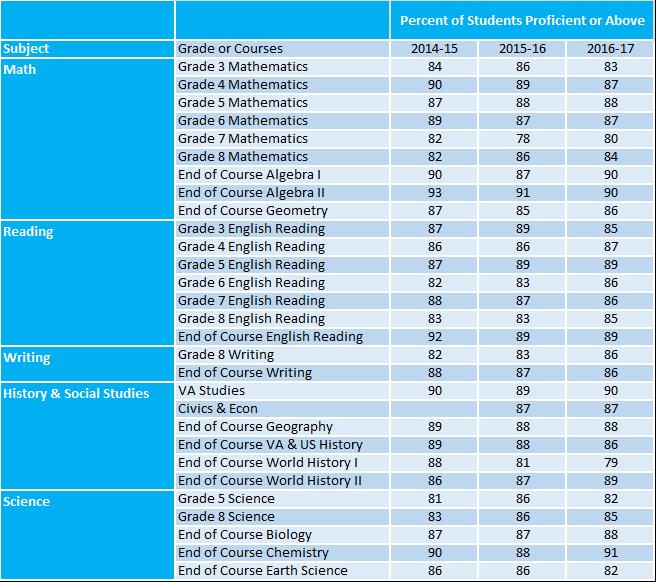
In 2017, APS met or exceeded the state passing rates on 28 of 29 assessments, across all grade levels and subjects. APS exceeded the state passing rates by 5 or more percentage points on 17 of the assessments.
Some key highlights include:
- Scores remained constant across the majority of tests (21), with scores remaining in a range of +/- 2 percentage points over 2016.
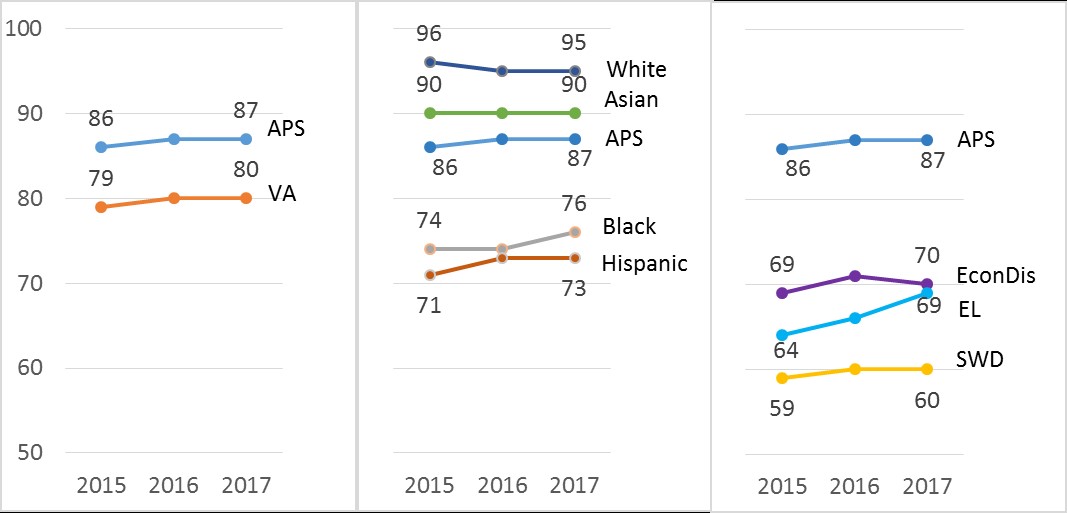
- While reading scores overall remained constant, the passing rate increased for Black students and English Learners (ELs)
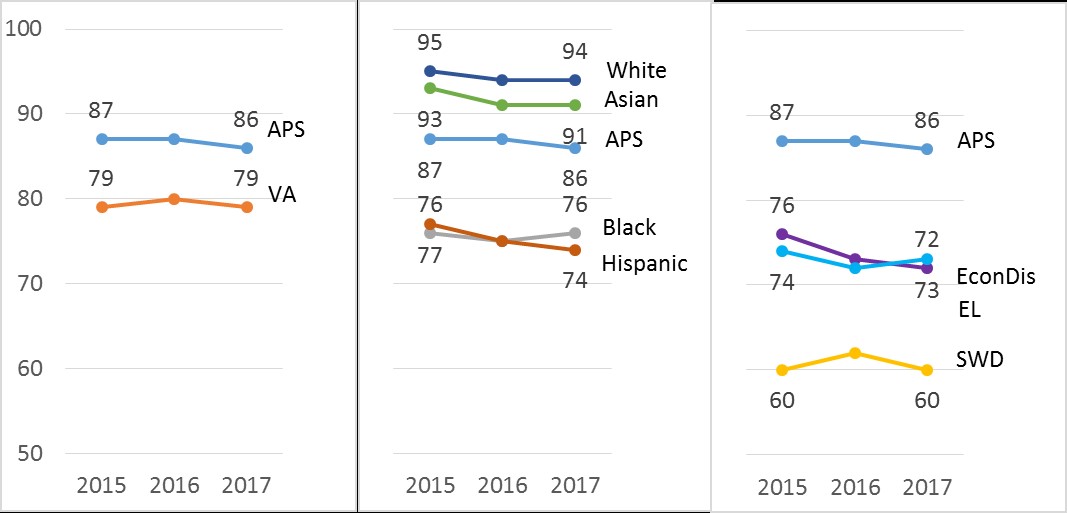
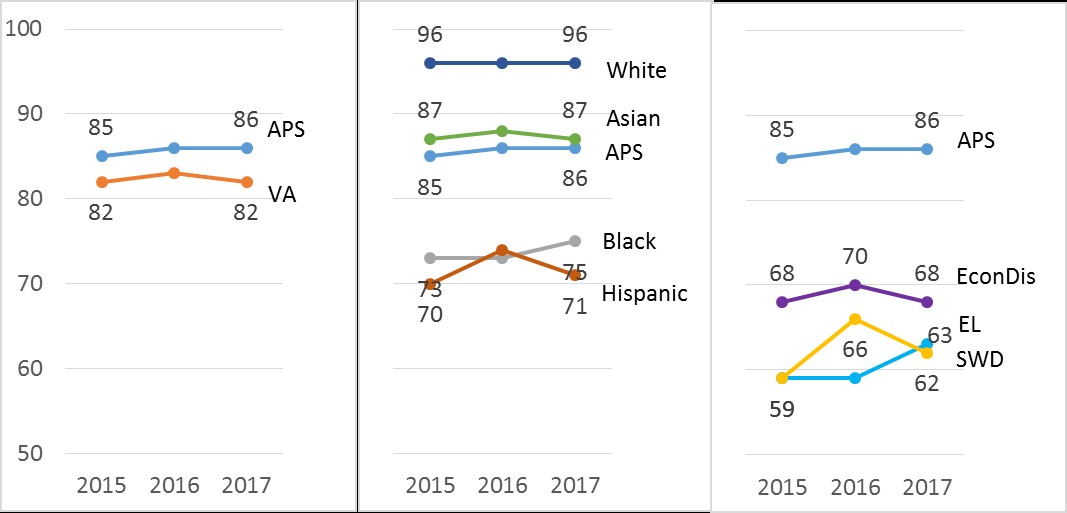
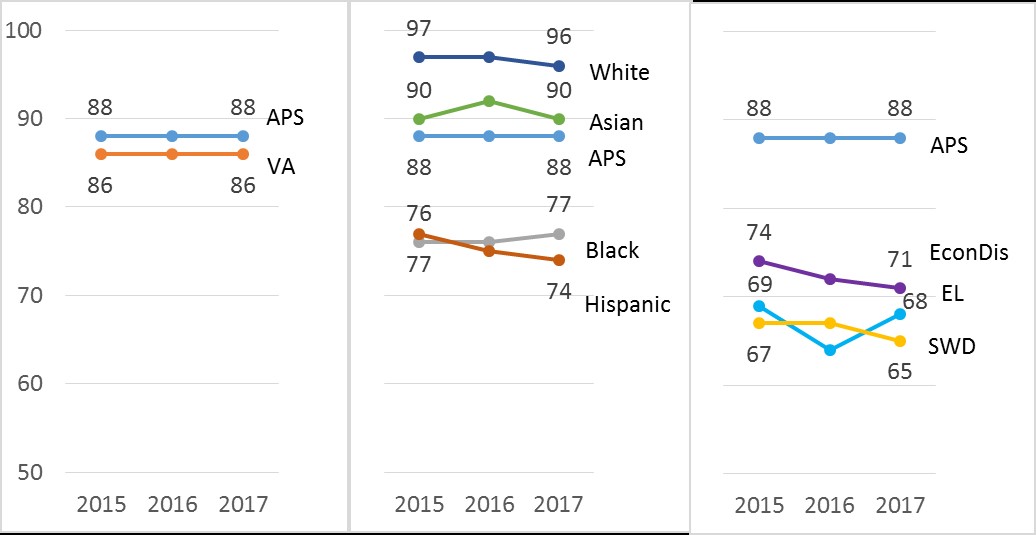
- There were gains for Black and EL students across the four content areas.
Superintendent Dr. Pat Murphy said, “It is rewarding for all of us to see again this year that all of our schools are Fully Accredited by Commonwealth of Virginia. This reflects the positive influences of our entire staff – bus drivers, custodians, administrators, support staff, and most significantly, our teachers. Thank you to all who play a role in creating success for our children.”
State SOL assessments are given to all students in Grades 3 through 8 in English Language Arts (Reading/Writing), Math, Science and Social Studies, and in high school core subjects assessed by end-of-course exams.
A few years ago, the Virginia Board of Education adopted more rigorous standards to meet national and international benchmarks for college-and-career readiness and better prepare Virginia students to compete in a global economy.
State accreditation reports, including student group and annual measurable objective (AMO) data, will be issued by VDOE on September 13, along with updated School Quality Profiles.
These graphs and tables show APS progress and are aligned with the graphs and tables provided in the VDOE press release referenced above.
Figure 1. SOL Passing Rates in Reading, Overall and by Reporting Groups
Figure 2. SOL Passing Rates in Math, Overall and by Reporting Groups
Figure 3. SOL Passing Rates in Science, Overall and by Reporting Groups
Figure 4. SOL Passing Rates in History & Social Studies, Overall and by Reporting Groups
 Contact
  Calendars
 Careers
 Engage
  District
